

Sparklyr Joy
When you have a tonne of event logs to parse what should the go to weapon of choice be? In this article I’ll share with you our experience with using spark/sparklyr to tackle this.
At Honestbee 🐝, our event logs are stored in AWS S3, delivered to us by Segment, at 40 minute intervals. The Data(Science) team uses these logs to evaluate the performance of our machine learning models as well as compare their performance, canonical AB testing.
In addition, we also use the same logs to track business KPIs like Click Through Rate, Conversion Rate and GMV.
In this article, I will share how we leverage high memory clusters running Spark to parse the results logs generated from the Food Recommender System.
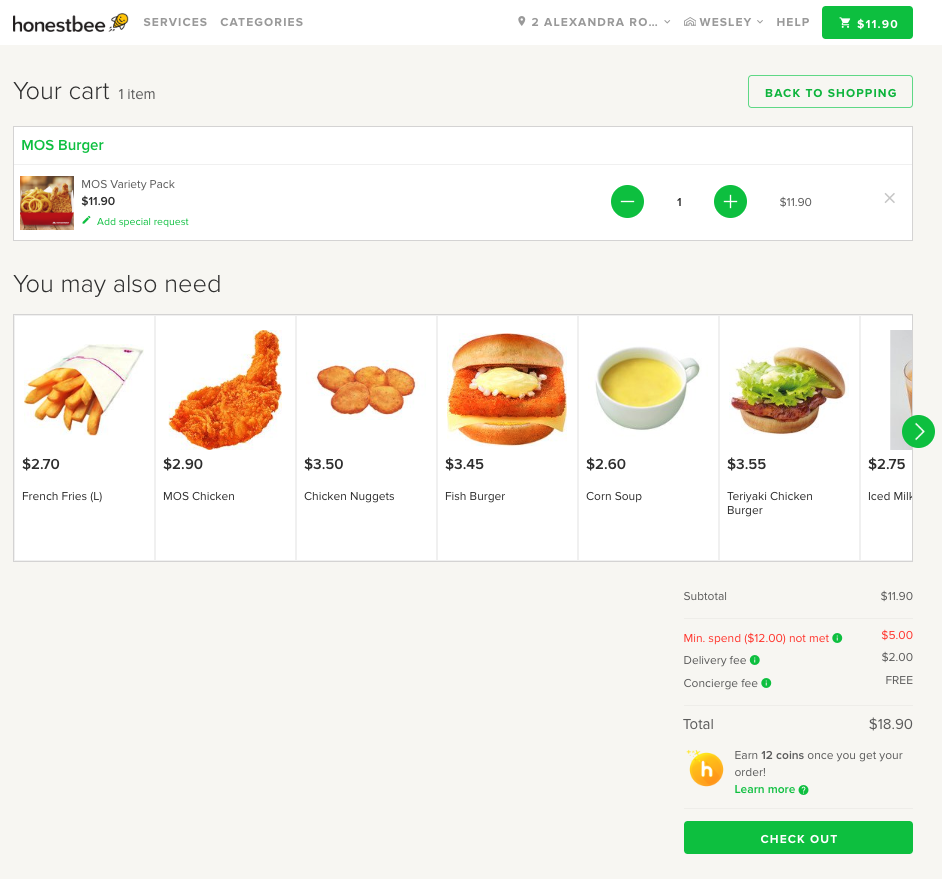
Fig: Whenever an Honestbee customer proceeds to checkout, our ML models will try their best at making personalised prediction for which items you’ll most likely add to cart. Especially things which you missed or .
A post mortem, will require us to look through event logs to see which treatment group, based on a weighted distribution, a user has been assigned to.
Now, LETS DIVE IN!
Lets begin by importing the necessary libraries
Connecting with the high memory spark cluster
Next, we’ll need to connect with the Spark master node.
Local Cluster
Normally if you’re connecting to a locally installed spark cluster you’ll set master as local.
Luckily sparkly already comes with an inbuilt function to install spark on your local machine:
sparklyr::spark_install(
    version = "2.4.0",
    hadoop_version = "2.7"
)
We are installing Hadoop together with spark, because the module required to read files from the S3 Filesystem with Hadoop
Next you’ll connect with the cluster and establish a spark connection, sc.
Caution: At honestbee we do not have a local cluster, so the closest we got is a LARGE EC2 instance which sometimes gives out and you probably want a managed cluster set up by DEs or a 3rd party vendor who knows how to deal with cluster management.
Remote Clusters
Alternatively, there’s also the option of connecting with a remote cluster via a REST API ie. the R process is not running on the master node but on a remote machine. Often these are managed by 3rd party vendors. At Honestbee, we also chosen this option and the clusters are provisioned by Qubole under our AWS account. PS. Pretty good deal!
The gist above sets up a spark connection sc, you will need to use this object in most of the functions.
Separately, because we are reading from S3, we will have to set the S3 access keys and secret. This has to be set before executing functions like spark_read_json
So you would ask what are the pros and cons of each. Local clusters generally are good for EDA since you will be communicating through a REST API (LIVY).
Reading JSON logs
There are essentially two ways to read logs. The first is to read them in as a whole chunks or as a stream — as they get dumped into your bucket.
There’s two functions, spark_read_json and stream_read_json the former is batched and the later creates a structured data stream. There’s also the equivalent of for reading your Parquet files
Batched
The path should be set with the s3a protocol.
s3a://segment_bucket/segment-logs/<source_id>/1550361600000
json_input = spark_read_json(
    sc = sc,
    name= "logs",
    path= s3,
    overwrite=T)
Below’s where the magic begins:
As you can see it’s a simple query,
- Filter for all
Added to Cartevents from theFoodvertical - Select following columns:
CartIDexperiment_idvariant(treatment_group) andtimestamp
- Remove events where users were not assigned to a model
- Add new columns
fulltimereadable timetimethe hour of the day
- Group the logs by service
recommenderand count the number of rows - Add a new column
eventwith the valueAdded to Cart - Sort by time
Spark Streams
Alternatively, you could also write the results of the above manipulation to a structured spark stream.
You can preview these the results from the stream using the tbl function coupled to glimpse.
sc %>%
    tbl("data_stream") %>%
    glimpse
Observations: ??
Variables: 2
Database: spark_connection
$ expt <chr> "Model_A", "Model_B"
$ n    <dbl> 5345, 621
And that’s it folks on using Sparklyr with your event logs.
Model Metadata
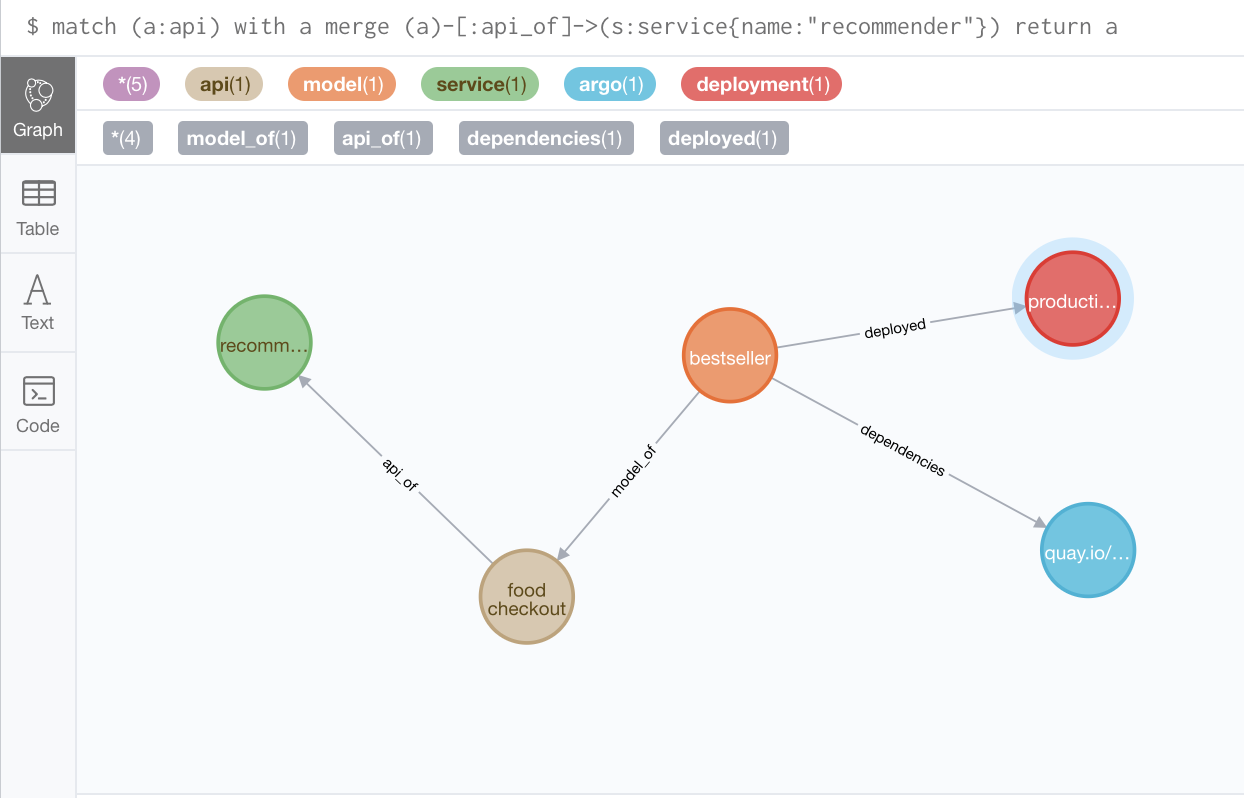
With that many models in the wild, it’s hard to keep track of what’s going on. For my PhD, I personally worked on using Graph Databases to store data with complex relationships and we are currently working on coming up with such a system to store metadata related to our models.
For example
- Which APIs they are associated with
- What airflow / argo jobs are these models being retrained with
- What helm-charts and deployments metadata these models have
- And of course meta data like the performance and scores.
Come talk to us, we are hiring! Data Engineer, Senior Data Scientist
comments powered by Disqus