
A recent paper which came out on Microbiome was from Daniel Huson’s group using a new gene-centric function found within MEGAN 6 CE.
You could use a sample fastQ to generate MEGAN summary file and do this.
Simulation

Here at Singapore Centre for Environmental Life Sciences Engineering (SCELSE) NUS, Peter and myself work on a variety of Bioinformatics analyses concerning the Microbiome of Ulu Pandan’s microbial community. This ultimately led to pipelines and tools based on the sequencing data we retrieve from wastewater samples.
One of the topics I work on surrounds the development of a gene centric assembly analysis for poorly annotated microbiomes.
Our method briefly is split into the following steps
- Function binning using MEGAN’s Lowest Common Ancestor (LCA) algorithm,
- NEWBLER’s implementation of the Overlap Layout Consensus (OLC) and
- Conserve region analysis using a defined Maximum Diversity Region pAss.
Unlike Huson et al., we explore the alignment of contigs against respective reference sequences before deciding upon a consensus region based on a multiple sequence alignment of reference sequences with captures the most number of contigs thus facilitating a diversity analysis. To understand the dynamics of such a workflow, we have decided on firstly running this on an in silico simulation of 329 bacterial and archeal species, modelled after the abundance curves obtained from an initial whole genome short read analysis.
In this post, I’ll wont be diving too deeply into details but a outline how one would use the pipeline in general starting from raw fastQ files.
1. Homology search of the short reads
Many databases could be used but NR Protein is a good place to begin. A useful tool for comparing short reads with a protein database is DIAMOND.
2. Binning short reads into functional groups
Once you’ve gotten the reads sorted in the proper directories we can begin assembling them. Here we use MEGAN’s blast2lca tool
3. Run NEWBLER OLC Assembler on each of the bins
However because you’ll be running the assembler possibly on 9000 different KOs or more, I’ve written a python class to run NEWBLER.
4. Run pAss and identify the Max Diversity Regions
This is truly where our work begins.
MDR
The core algorithm works as follows:
Implicit MSA of contigs
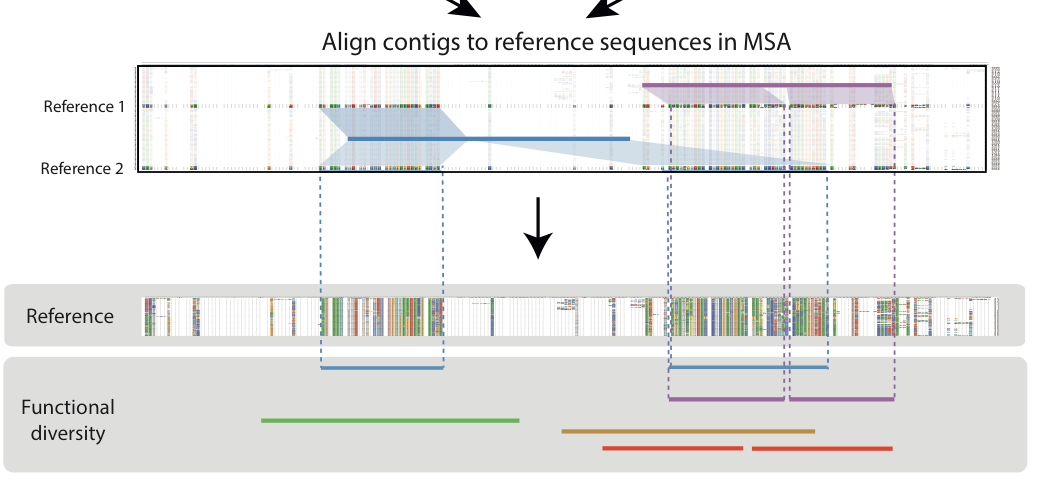
- Firstly we begin by generating a MSA of protein reference sequences.
- Thereafter, using MEGAN, we gathered contig-reference sequence (prot) alignments before assigning one best aligned reference to each contig.
- Finally, we lined the contigs up according to the their cognate reference sequence’s position in the MSA.
Window of diversity
- We ran a 200 bp sliding window across the implicit contig alignment to find a region with capturing the most number of contigs also known as a maximum diversity region (MDR)
Simulation
With the simulation, we looked specifcally at Single Copy Genes (SCGs) to see if the method “worked”.
- If the genes have been successfully assembled
- If homology search + LCA was able to correctly identify these assembled genes to the correct genus.
Briefly, the conclusions made from this simulation was that the process leads to a overestimation in the number of genes due to duplication of genes introduced as an artifact of the assembly process.
This could be circumvented in several ways and we have come up with two.
1. Duplication decreases this decreases when we stipulate the contigs to span the entire length of the window.
2. Additionally, we remove low quality contigs by thresholding contigs by their read counts until the number of duplicated genes (multiple contigs same gene from same genome) stabilised. (This could only be done in the simulation knowing where the contigs came from based on the identity of the reads)
   Alternatively, instead of read counts, the option to threshold based on coverage could also be done.
Part: 2 Empirical data
The continuation and next part of this blog on the analysis performed on empirical sewage data.
Softwares
- Protein homology search using DIAMOND.
- Binning of short reads using pymegan for converting raw reads into LCA-ed taxonomic assignments and KEGG based functional assignments.
- Assembly of bins using the OLC assembler NEWBLER, identification of the maximum diversity regions (MDR) using pAss.
- Analysis of MDR and integration with noSQL database omics using R package metamapsDB.
Future works
Make this process more friendly to other types of OLC / K-mer assemblers.